“Science is a process, not a product.”
This post is NOT about climate change.
GOOD SCIENCE?
A study has been carried out to determine the cause of statin side-effects.
According to the results of this study the side-effects of taking statins weren’t caused by the drug itself but psychologically – a kind of hypnotic effect; Belief is a very powerful force, which is why serious studies are always conducted “double-blind” (Where neither the patient nor doctor knows whether the pills are real or dummies.)
This appears to be a very serious study professionally carried out, but there are serious caveats; The lead author of the study takes the drug himself and the study was paid for by Pfizer – the producer of the drug. This doesn’t mean that the results aren’t genuine, but one would be more confident if such a study were financed by an independent body.
http://www.dailymail.co.uk/news/article-4467982/Tens-thousands-die-scared-statins.html
An ecological study
https://www.usatoday.com/story/tech/science/2017/07/10/earth-faces-sixth-mass-extinction/465655001/
A medical study
https://www.usatoday.com/story/news/nation/2013/10/02/study-icu-coma-brain-impairment/2912441
FAD SCIENCE:
Is the “good health” industry distorting science to create a “band-wagon” effect?
A study by Harvard University has found no correlation between gluten and coronary heart disease.
Omega-3 supplements in doubt.
Put it ON your body, not IN your body!
The way to good health is glutton free! – and TRANS fat!

Lose weight and look fit – but don’t overdo it!
http://thehill.com/regulation/healthcare/245093-fda-to-phase-out-trans-fat
SPECULATION:
https://www.rt.com/news/388245-big-bang-bounce-hawking-letter/
BAD SCIENCE:
CON FUSION!
https://lofi.phys.org/news/2008-05-physicist-real-cold-fusion.html
BRAIN WASHED!
Here we go again – it’ll be little green men next, or maybe ice on the sun!
https://www.bbc.co.uk/news/science-environment-44952710
There’s no physical evidence.
There’s no chemical evidence.
There’s no spectral evidence.
The radar signatures could be that of numerous substances such as frozen CO2 known as dry ice of which there are tons at the poles.
It’s like claiming the ultra-sound scan of a pregnant woman is that of a monkey! The technology isn’t that accurate.
REAL SCIENCE:

THE 2004 TRANSIT OF VENUS:
![]()
8th June 2004
Start 05:13 UT
END 11:26 UT
I was living in a flat above a pub in Kendal (England) at the time when I found out that there was going to be a transit of Venus. I always had a casual interest in astronomy but transits don’t particularly inspire me. However when I found out that it would be the first one of only two transits to occur in the century I became interested. I decided to video it by the projection method but on the morning of the transit I overslept and missed the start. I hastily cobbled up a projection system using an electric heater as the screen and a pair of binoculars as the projector. The camera I used was a Logitech QuickCamPro 3000 ccd with a resolution of 640×480 which was also used to record a B.B.C. report of the event.
https://www.4shared.com/video/mJAfZ8rpfi/4_venus-transit.html
https://www.4shared.com/video/NIy_zCWifi/transit_tv__10_.html
https://en.wikipedia.org/wiki/Transit_of_Venus
NEVER! stare at the sun. It is 5000 times brighter than a frosted 100 Watt incandescent light bulb and you will be blinded; Use special solar glasses for eclipse viewing.
DYEING TO BE DISCOVERED:

CONTENTIOUS SCIENCE:
https://www.therebel.media/there_never_was_a_hole_in_the_ozone
TRUST:
https://www.tagesspiegel.de/wissen/stark-von-geldgebern-abhaengig-vertrauen-in-die-wissenschaft-sinkt-waerhend-coronakrise-weiter/26704788.html
This site is in German.
It also doesn’t help when the director of the NIAID states on TV – “There’s no reason to be walking around with a mask” – and then changes tune!
SCIENCE MARCHES:
https://www.marchforscience.com/mission-and-vision/
“As YOU have told us, science is critical to our future – science protects our water and air, extends our lives and improves our health, protects our planet, and brings our imagination to life.”
https://www.marchforscience.com/why-we-march/
Science has also given us the labour saving technologies that we have become used to – many of which wouldn’t have been possible in a repressive society. It was only by living in a free and democratic society that those inquiring minds were able to do experiments and publish and develop their ideas.
BETRAYED:

In a more rational world, children would learn about nature and a mode of inquiry—the scientific method—that would awaken them to the awe, fascination, and surprise that the universe should inspire. Instead, the chronic problems afflicting K–12 education and the growing politicization of science have pushed us ever further from that ideal.
https://www.city-journal.org/k-12-science-curriculum-environmen
FAMOUS SCIENTISTS:
WHAT’S THE BIG DEAL?
https://en.wikipedia.org/wiki/Brexit_and_arrangements_for_science_and_technology
A TROPOSPHERIC ELECTRIC FIELD MONITOR
This monitor in conjunction with a simple wire antenna detects the small electric currents that flow in the troposphere. These currents are caused by an electric field whose potential increases with altitude. This field has been investigated since the eighteenth century and has been shown to have a strong diurnal variation. This variation has been observed and logged to a computer for later analysis. Other variations of the field were evident some of which were caused by local effects; The proximity of conducting objects to the antenna, CRT TV sets, an electric heater and a fan gave a response.
Source of the field:
The ionosphere and the Earth constitute a huge diffuse capacitor. This capacitor is electrically charged which is responsible for the electric field. It has been estimated that the potential of the ionosphere can be as high as +300KV or more with respect to Earth. As the tropospheric current is constantly discharging this capacitor it must be continuously recharged to maintain the potential. Thunderstorms have been investigated as a possible source but no consistent theory has emerged.
The monitor was developed and tested in a first floor flat of a two-story building with only an attic above. There were no tall structures within 50 metres. Electrical wiring for lighting and for an alarm system was laid out on the floor of the attic.
Two units are described: A main amplifier and an auxiliary DC booster amplifier.
Two versions of the main amplifier are described: A test circuit developed on a ‘bread board’ (V0) and a modified circuit on a printed circuit board (V1b).
DESCRIPTION
ANTENNA: ORIGINAL CONFIGURATION
The antenna consists of 16 stranded PVC covered twin speaker cable (0.3mm²) with both wires connected together. It is about 21 metres long in total and is fitted near to the ceiling of all the main rooms of the flat along the outside walls to avoid electrical wiring. The effect of the PVC covering has not been tested.

MONITOR:
POWER SUPPLY:
The main unit is fed from a ZX-Spectrum computer power supply. This gave stabilised plus and minus 12-Volt outputs. This output is further reduced and stabilised to approximately plus and minus 8 Volts using LM317 and LM337 programmable voltage regulator chips. The auxiliary amplifier is fed directly with plus and minus 12 Volts from the spectrum power supply.
TEST CIRCUIT (V0)
The antenna is connected to the non-inverting input of a jfet op-amp buffer stage (U1) through a resistor chain (R23). The output of the buffer is passed to the input of a two-stage low-pass filter chain (U2, U3). The output of the filter splits into two routes: An AC path with a gain of 101 to amplify small short-term variations of the field by U4. A DC path with no gain, which passes to an auxiliary DC amplifier with adjustable gain and offset from U3. An external filter was included to give a stable reading on a digital voltmeter.
Resistor chain (R23): A composite arbitrary resistance made up from individual 10Meg, 47Meg and 4.7Meg resistors wired in series.
SCHEMATIC
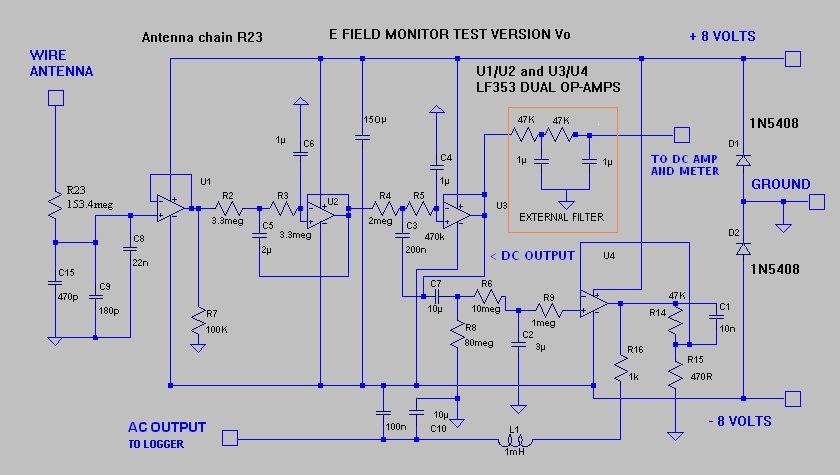
The saturation output of the op-amps at this voltage was ~ +/- 7.2Volts.
DC AMPLIFIER:
The DC signal from the main unit passes through a jfet buffer stage IC1/a and then to a gain/offset stage IC1b (LF353). Low pass filters are included to suppress any interference pick-up from the cables. (R2 C2, R12 C4, R5 C6, R17 C5, R16 C1, R18 C3)

This monitor was developed and tested in a domestic environment. As such due to the local influences mentioned above, data was only assumed to be valid when such influences were absent.
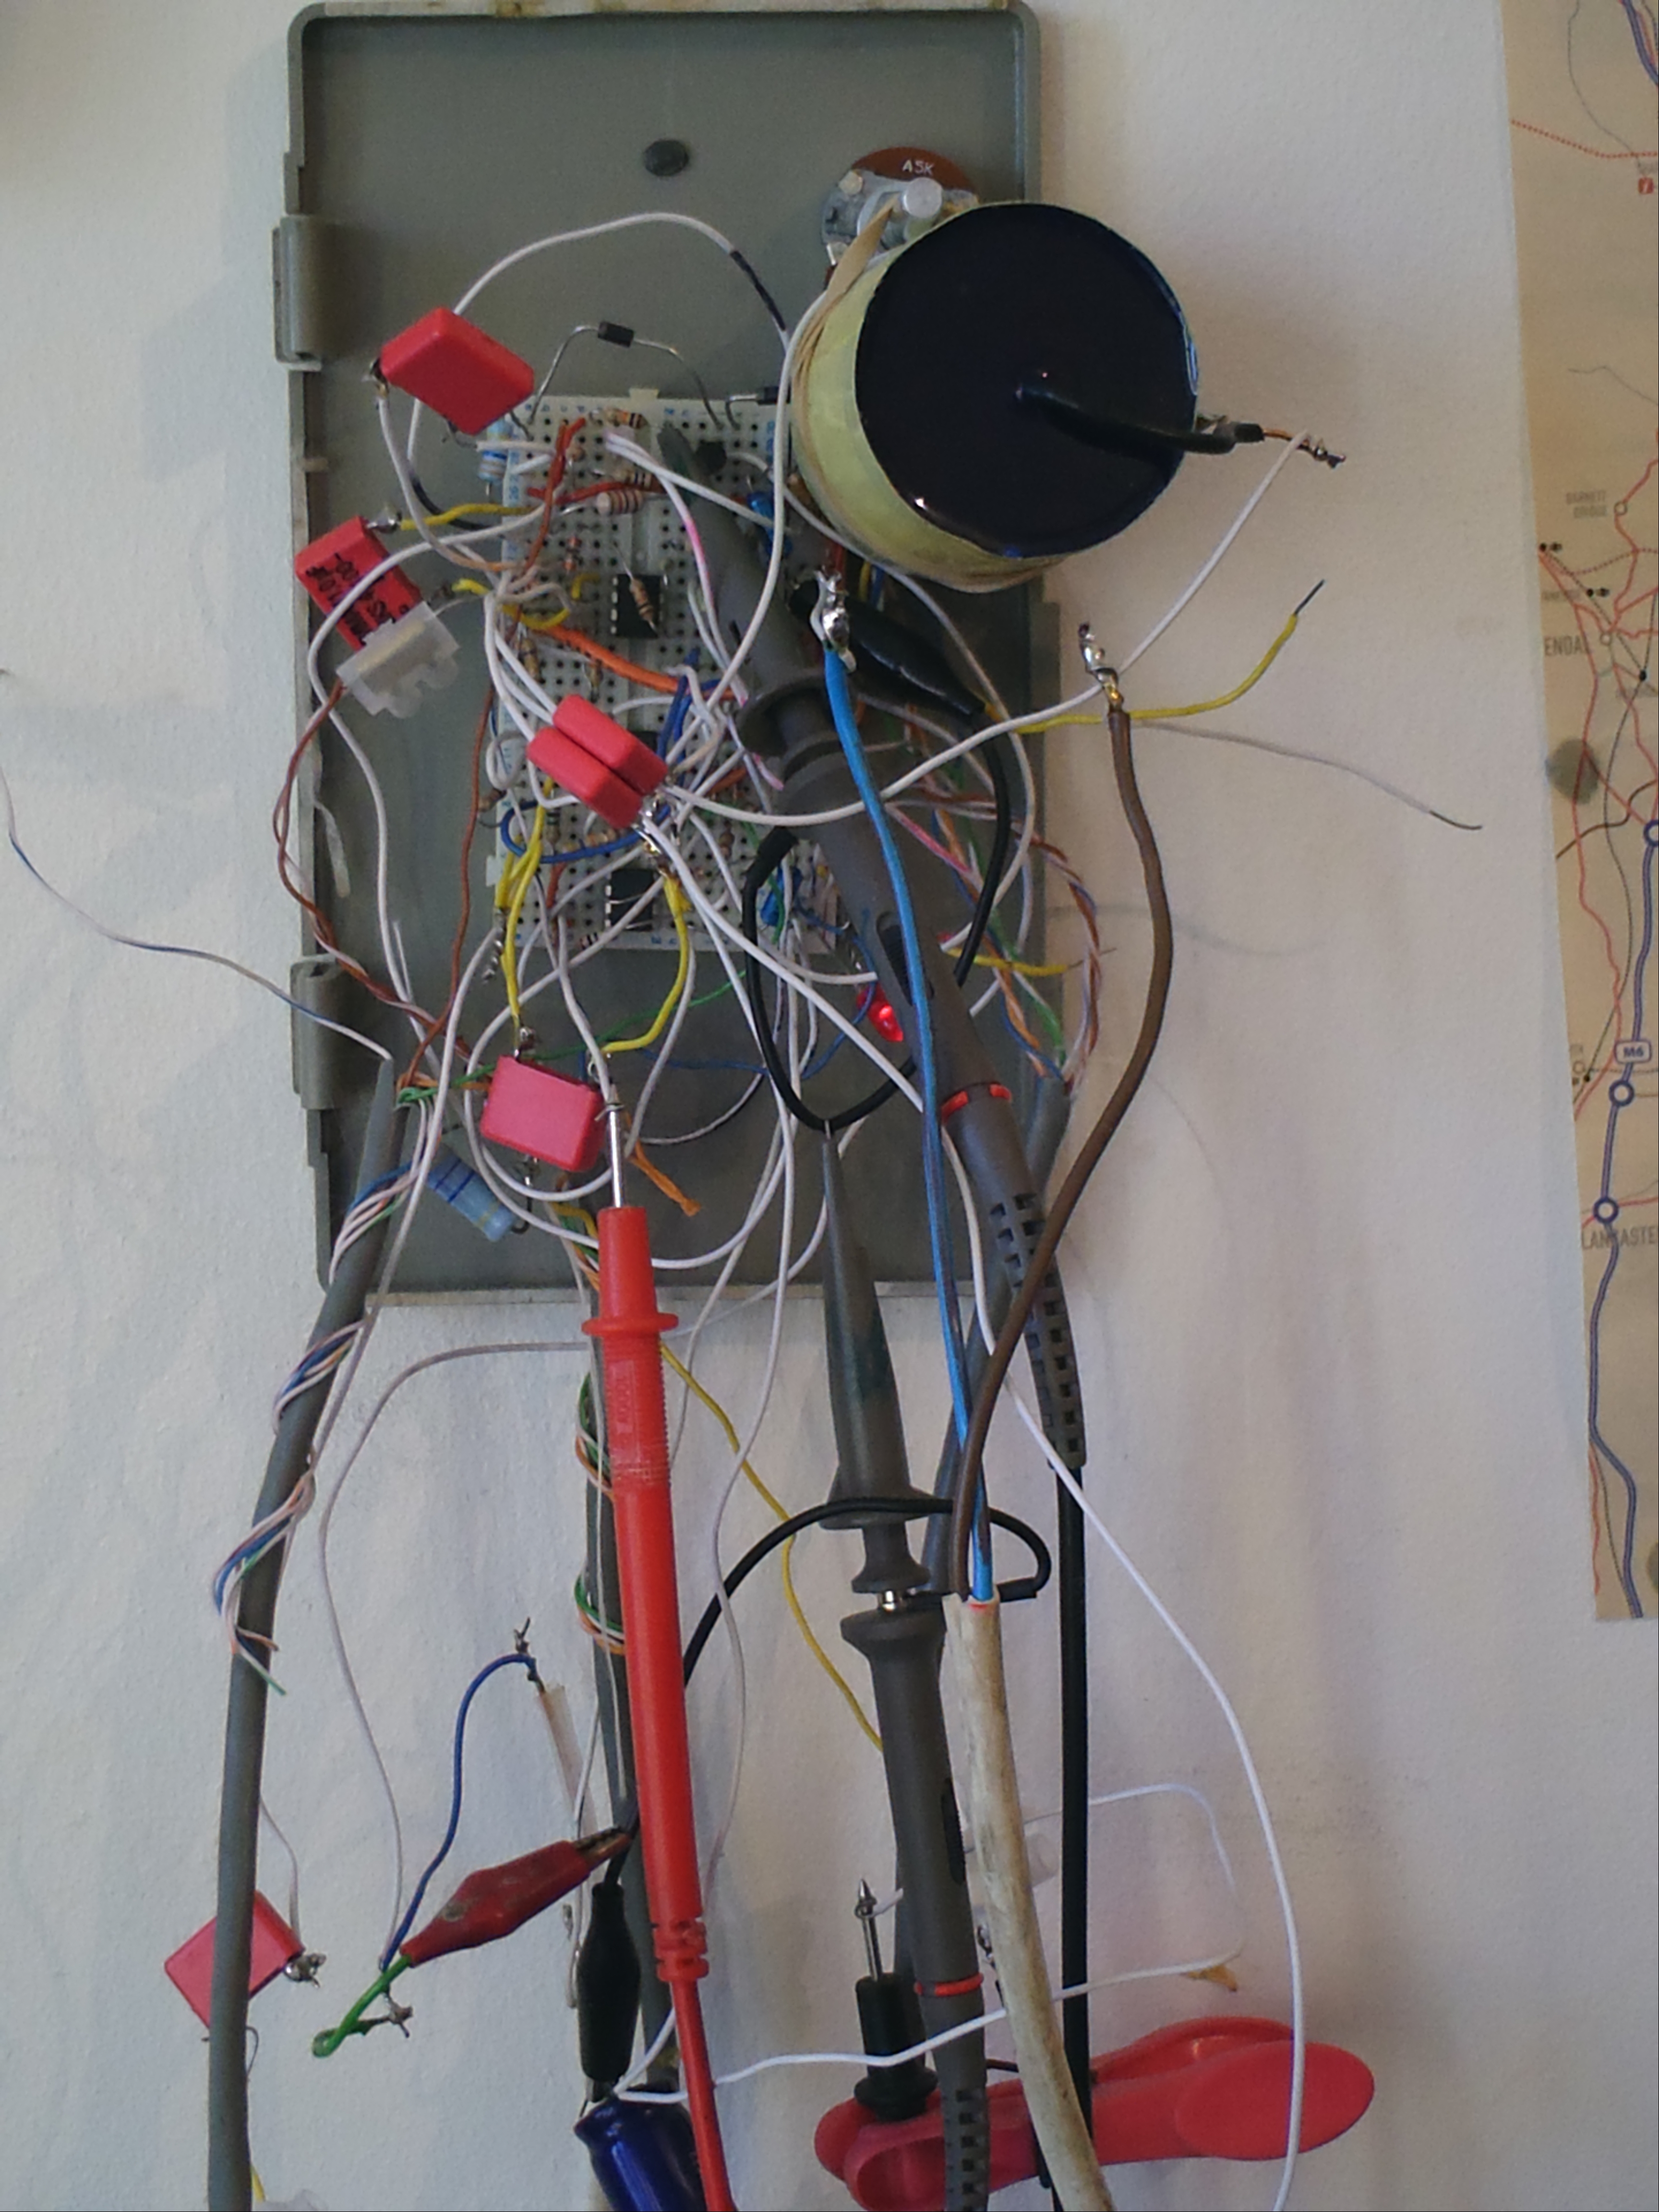
MAIN UNIT ON TEST IN AN EARLIER STAGE OF DEVELOPMENT
MODIFICATIONS:
(Main unit V1)
a) The antenna signal was routed through a discrete jfet transistor instead of directly to the op-amp, as there were failures in some units that were attributed to high voltage spikes on the antenna. The discrete component proved to be more robust to electrical stress.
b) Filters altered. This was due to component sourcing problems and had little effect on the frequency response.
(Main unit V1b)
A 1K protection resistor (R12) was included in the DC output.
E -FIELD MONITOR MAIN UNIT V1b SCHEMATIC
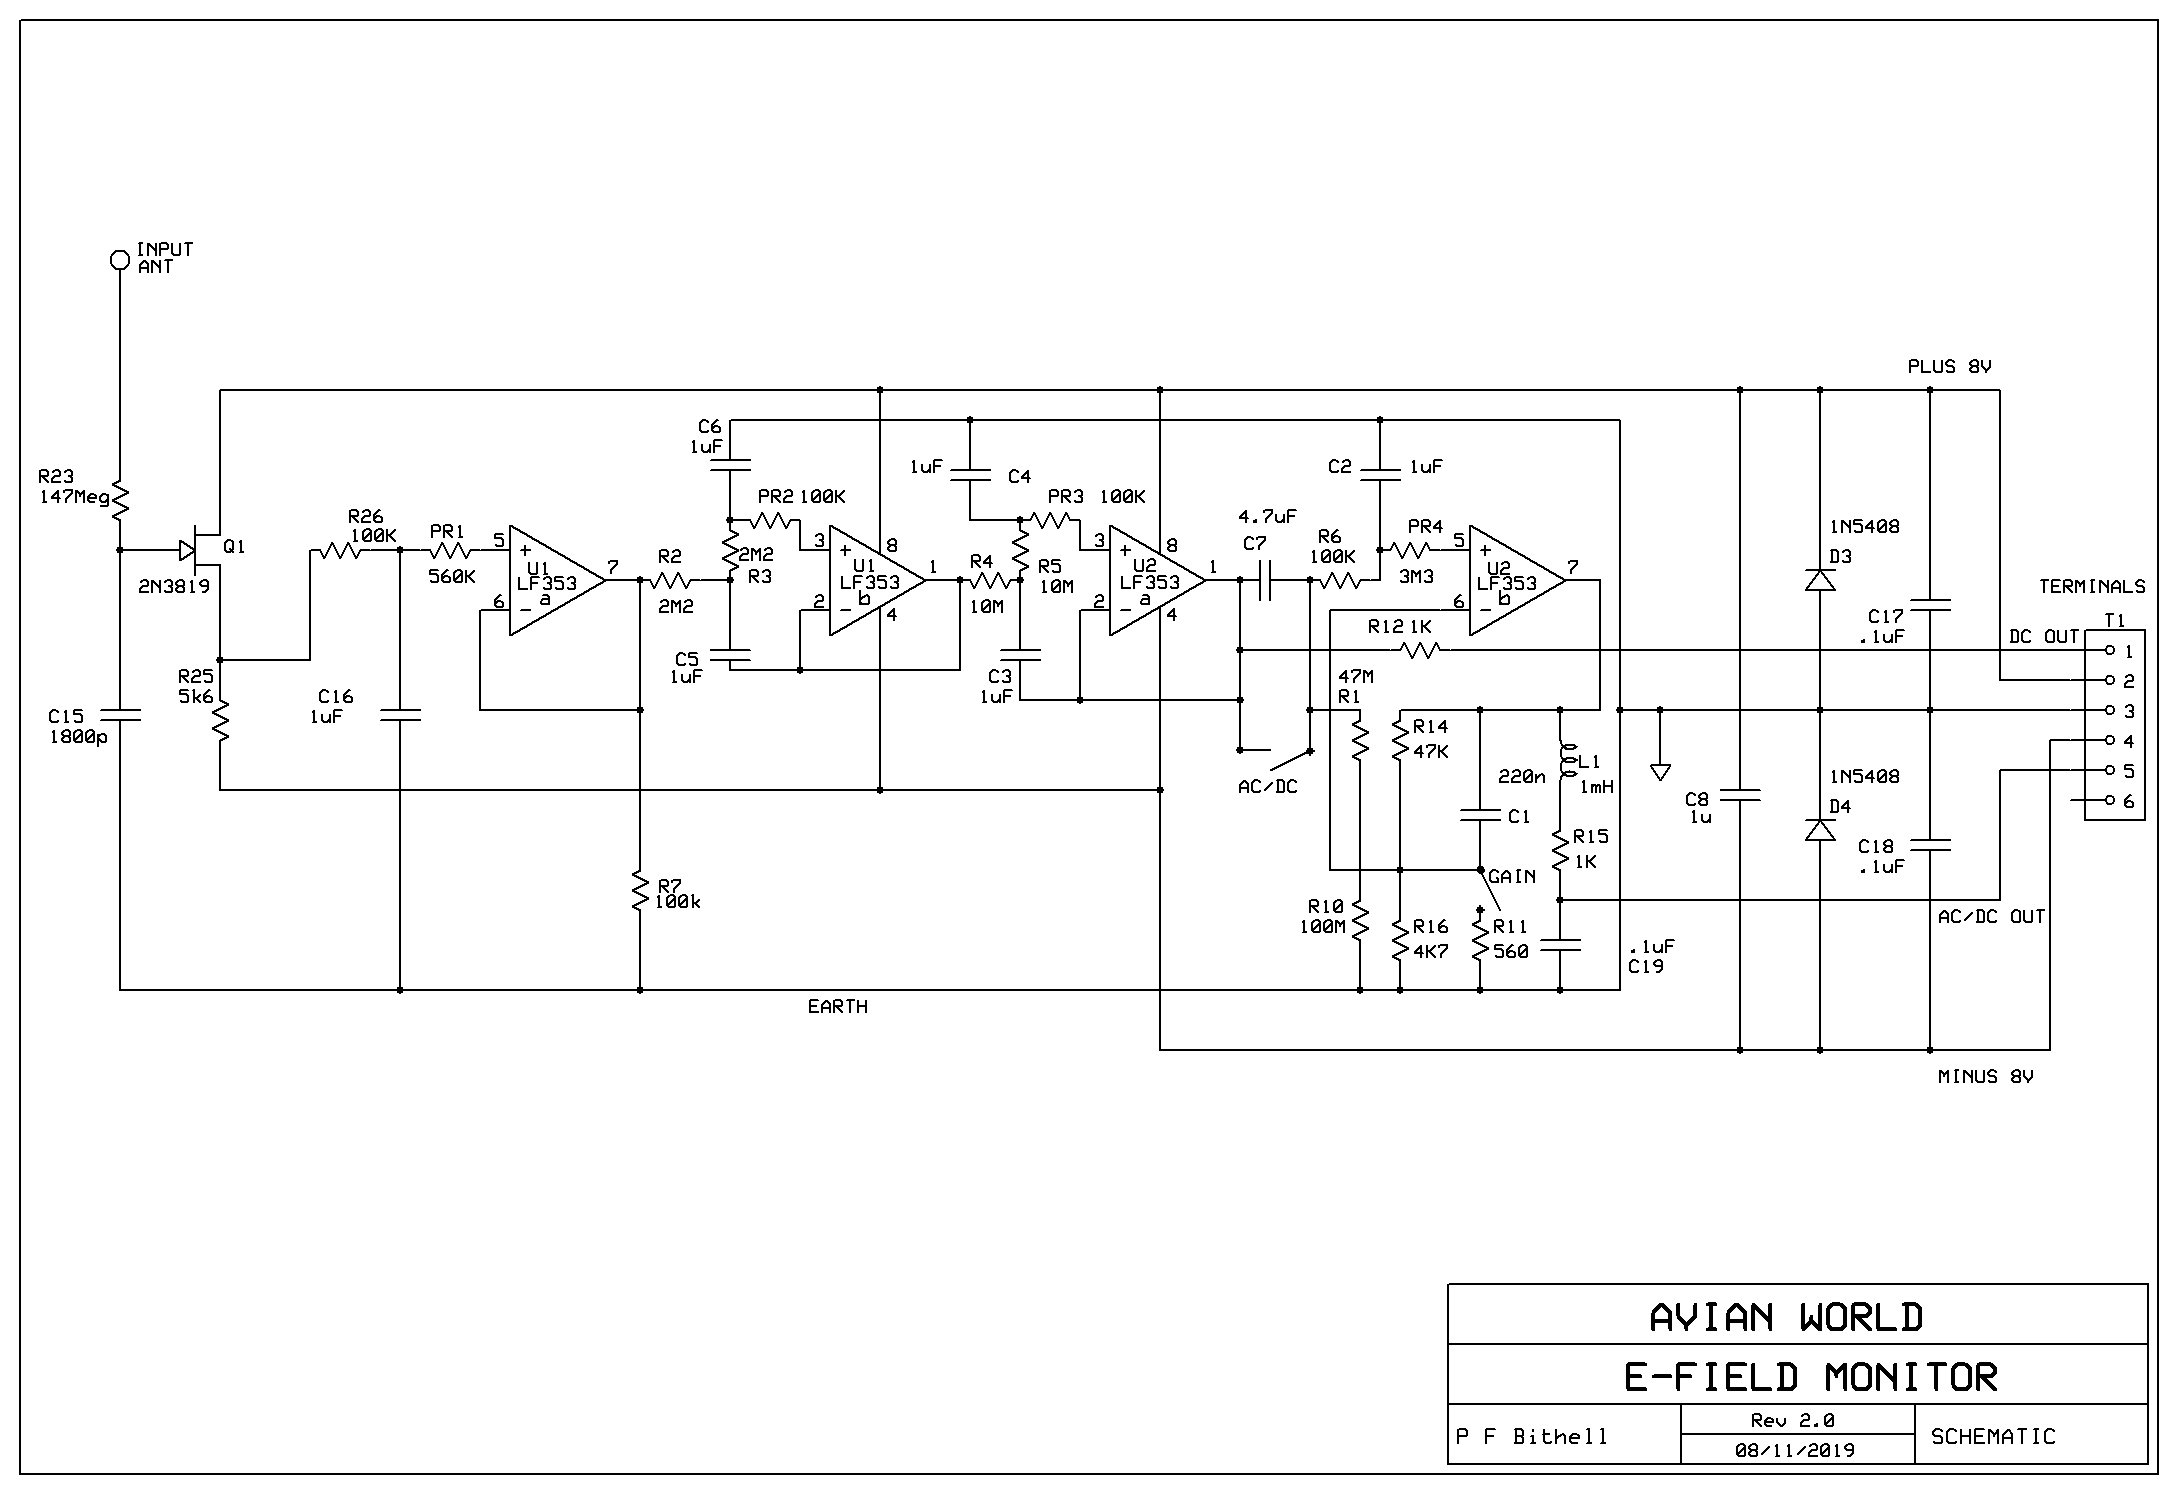
ExpressPCB software
Description (V1b)
THE INPUT CIRCUIT; R23, C15, Q1, R25, R26, C16,
THE ANTENNA HUM FILTER: R23, C15
(No power applied.)
The wire antenna picked up a substantial voltage from the mains wiring which caused a current to flow in the input circuit. This swamped the minute tropospheric field current. R23 and C15 form a high pass current filter. This attenuates the mains field pick-up current into Q1 by shunting most of it to earth. The tropospheric field current along with the residual mains-field pick-up current passes through the gate resistance of Q1 and the parallel resistances of C15 and parasitic resistances to earth. The resistance of the gate in parallel with the resistance of C15 and parasitic resistances cause a potential to develop between the gate and source.
The potential across R25 is negligible. R26, C16 further attenuates any hum pick-up that has passed through the transistor.
The signal passes through a unity gain op-amp buffer stage U1/a and then through op-amps U1/b and U2/a and then to a final amplifier stage U2b. U1/b and U2/a and their associated components R2, R3, C5, C6 and R4, R5, C3, C4 are second order low pass Butterworth filters intended to suppress frequencies above the Nyquist frequency which otherwise could produce erroneous signals. Changes in the sample rate required corresponding changes to these components. Filter R6, C2 were part of the original hum-filter chain before the introduction of the Butterworth filters and don’t significantly improve the attenuation. Filters R14, C1 and L1, R15, C19 are included as ‘mop-up’ filters for microwave signals from WIFI and mobile phones/masts which could break through on the wiring. PR1 through to PR4 are protection resistors for the input jfets and are not needed for the operation of the circuit. C8, C17, C18 reduce high frequency interference which may evaded the filters in the power supply. D3 and D4 are fitted to protect the circuit from an inadvertent reversed connection of the power leads.
The amplifier stage: (U2b)
This operates in the non-inverting configuration and the gain is set by R14 and R16 according to the equation G = (R14/R16)+1. The gain can be altered by switching in or out the parallel resitor R11 by a switch wired to the pads ‘G-SW’ on the printed circuit board. The DC component can be removed by C7 by a switch wired to pads ‘AC/ DC ‘ if the amplifier overloads. The time constant is set long at around 690 seconds by C7, (R1+ R10) in order to show slow moving field changes.
COMPONENTS:
The DC filter capacitor in the test version (C7) used a 10uF 450-Volt polypropylene capacitor that had very low leakage current. This was changed to a 4.7uF 63-Volt polyester capacitor to fit on the board that had greater leakage current but didn’t affect the performance.
Critical components;
In order to maintain a high resistance as possible at the input stage, the antenna hum filter capacitors have polystyrene or polypropylene dielectrics (test version). In the p.c.b. version a single polystyrene capacitor is used.
The remaining filter components were chosen arbitrarily and adopted when an acceptable response from a simulator was obtained.
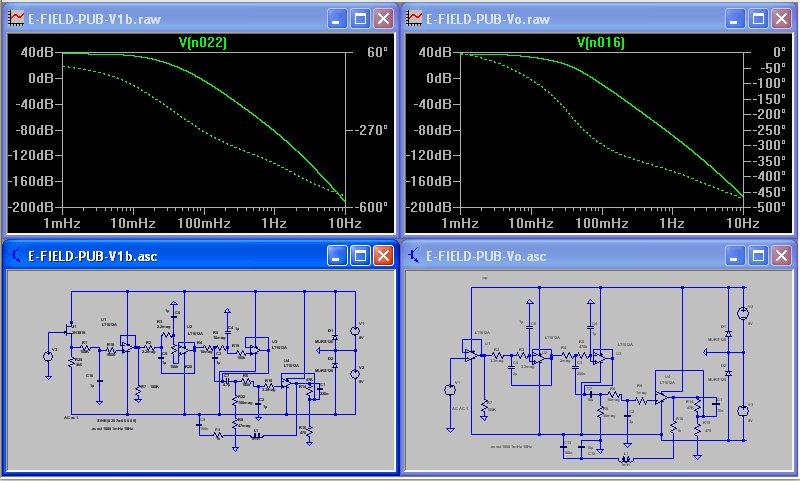
FREQUENCY RESPONSES: (Ltspice simulator) – AC output.
PRINTED CIRCUIT BOARD

COMPONENT LAYOUT

ExpressPCB software
D1 and D2 were included as protection diodes for U2 before the protection resistors were incorporated.
They were type BAT42 and substantially reduced the low frequency response and were removed.
https://www.4shared.com/file/gPavicMfea/e-field-pcb-pub_v1b.html
MAIN UNIT ASSEMBLED (V1)

THE LOGGER:
The logger and associated software have been undergoing improvements and debugging for 2 decades and is at such a point that events can be pinpointed to an accuracy of 5 seconds. Analogue data from the monitor is digitised and passed to a laptop computer for processing and display. An hourly time signal from the NPL atomic clock is multiplexed with the data, which provides this accuracy. The program is written in Qbasic.
Input range: +/- 5Volts
Data is logged in batches of 30 scans, 640 samples/scan/channel to a ‘Compaq’ laptop running windows 2000 in safe mode.
OBSERVATIONS: All times UT
The minor solar storm of the 20th April 2020. (Test version V0)
ANTENNA: ORIGINAL CONFIGURATION
DC GAIN ~ 20
AC GAIN ~ 100
A disturbance to the normal diurnal rhythm was first detected at 08:40h.UT on the 18th April when the field strength unexpectedly rose causing the AC channel to exceed the maximum range. This was followed by large undulations of the field for the next two days when between the 20th April at 22:38h.UT and the 21st April at 08:05.UT the field dropped and caused the DC channel to exceed the minimum range.
Due to quantization effects some of the hourly timing pulses don’t show up.


BATCH 1 – 13 (17/4/20 – 22/4/20)

DATE LOGGED TIME SUNRISE
1) 170420 07:33 05:04
2) 180420 07:25 05:01
3) 190420 07:38 04:59
4) 200420 07:14 04:57
Data from Starry Night enthusiast 4.5 (Location set to Kendal Cumbria England – Nearest location to actual location – Kirkby Lonsdale Lancashire.)
The disturbance of the 6th July 2020 (modified version V1b)
ANTENNA: ORIGINAL CONFIGURATION
DC GAIN ~ 5
AC GAIN ~ 100

This disturbance may be associated with an A5.42 solar flare reported by spaceweatherlive.com although the times don’t correlate.

INSTALLATION:
In order to keep interference as low as possible and improve the sensitivity, the unit is screened in a cast iron enclosure and sits on insulating plates. The enclosure is held at the same potential as the source of Q1 by a 470-Ohm resistor. This increases the effective resistance of the co-ax down lead and reduces local proximity effects. (Connecting the source directly to the plate ran the risk that an accidental grounding of the plate could have destroyed the transistor).
MONITOR INSTALLED IN A BEDROOM

NEW ANTENNA CONFIGURATION:
Due to local proximity interference the right-hand leg of the antenna was disconnected and connected to the left-hand leg.

THEORIES:
THUNDER STORMS:
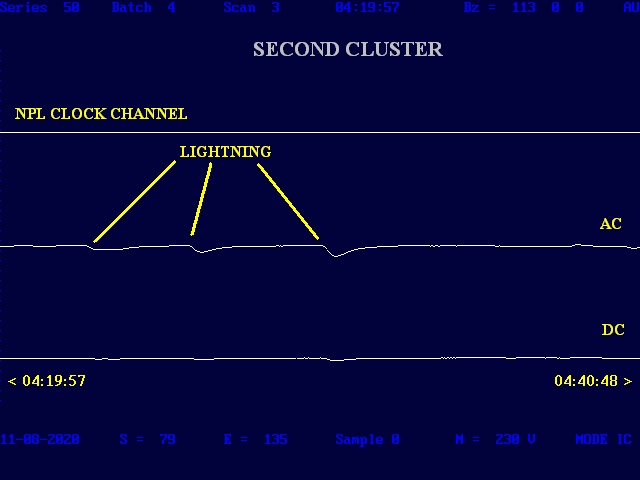
Thunder storms in this part of the world (Cumbria, U.K.) are rare but when they occur it gives an ideal opportunity to study the effect on the field current. During the storm that began on the 10th August 2020 there was a change to the normal pattern during the storm. The second lightning cluster at around 03:40h UT on the 11th was followed by a slight elevation to the field but the third cluster at around 09:00h UT was followed by a significant elevation to the field which wasn’t associated with the normal increase after sunrise. This could be because the third cluster of discharges occurred after daybreak when the ionosphere was stronger and closer or the events could be totally unrelated. However if lightning strikes are responsible for pumping charge into the ionosphere then one would expect the greatest variation to the field to be observed at places close to high strike regions which is in the equatorial regions. The opposite is true; the variation increases with latitude.

MAIN UNIT V1b
DC GAIN ~ 100
AC GAIN ~ 25
Lightning clusters on the 11th August 2020.
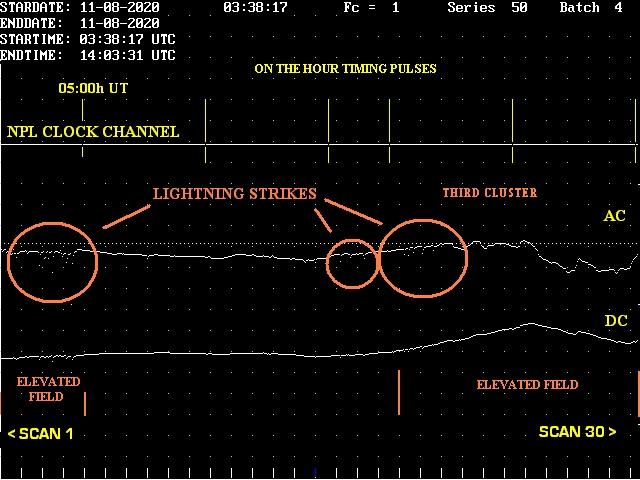
Lightning responses: Heavily damped due to the filters.
Most interference was of the transient type, which were readily identified by their characteristic waveform. This series of pulses have similar characteristics but were attributed to lightning from a statistical evaluation.
External influences that affect the field;
a) The input charge rate
b) The capacitance between the ionosphere and the ground
c) The resistance between the antenna and the ionosphere
d) The magnetic field
e) Cosmic rays
f) Ultraviolet and x-rays
The condition of the atmosphere will affect some of these parameters.
Clouds, humidity and precipitation will alter the resistance and capacitance.
Convection currents will move charges.
SOLAR WIND:
Disregarding local effects, the current is subject to continual variation, sometimes extreme. If the solar wind plays a significant role in the maintenance of the field then it will vary according to the power input and the condition of the atmosphere, mainly the conductivity. The ionosphere becomes less conductive at night and its height increases so there should be a marked decrease in the field current at this time. The power input is also very variable. However this variation takes place over a longer time scale – the 11-year sunspot cycle and according to spaceweather.com can be 3000% more intense at sunspot maximum than at minimum. In the short term at minimum ignoring sporadic storms the variation amounts to around +/- 50%.
THE DIURNAL VARIATION:
Having ruled out the regular diurnal variations of the atmosphere such as temperature and light intensity a plausible mechanism for the sun theory was considered. High-energy electromagnetic radiation from the sun is constant apart from being more intense around solar maximum and the occasional solar flare. The solar particle flux however is very variable. If these were the only considerations the current would be random. However the ultraviolet and x-rays have a considerable influence on the field strength. During the day this radiation which is responsible for the ionosphere is cut off after nightfall. The conductivity of the air begins to fall as the ions recombine. It starts rapidly at the lower levels but slower at the higher levels because the ions are further apart. In the morning as the sun rises, the ionosphere is rapidly re-established advancing downwards according to its angle in the sky. This should result in the field increasing after daybreak and slowly tailing off after noon.
The particles are not sprayed evenly over the sun-lit hemisphere rather they are funnelled to the poles due to the earth’s magnetic field. This results in an enormous surplus of protons in the vicinity of the poles that draw electrons from the ionosphere. There is therefore a current of electrons, which migrates from the equatorial regions towards the poles leaving the ionosphere positively charged. It should reach its maximum at points closest to the terminator. Is this the charge that causes the tropospheric field?
THE IONOSPHERE:
Ionization at any given level depends on three factors—the availability of photons of a wavelength capable of effecting ionization, a supply of atoms and molecules necessary to intercept this radiation, and the efficiency with which the atoms and molecules are able to do so. The efficiency is relatively large for O, O2, and N2 from about 10 to 80 nm. This is the portion of the spectrum responsible for production of electrons and ions in the F1 region. Photons with wavelengths between 90 and 100 nm are absorbed only by O2. They therefore penetrate deeper and are responsible for producing about half the ionization in the E layer. The balance is derived from so-called “soft” X-rays (those of longer wavelengths), which are absorbed with relatively low efficiency in the F region and so are able to penetrate to altitudes of about 120 km (75 miles) when the Sun is high over the region. “Hard” X-rays (those of shorter wavelengths—that is, below about 5 nm) reach even deeper. This portion of the spectrum accounts for the bulk of the ionization in the D region, with an additional contribution from wavelengths longer than 102.6 nm—mainly from photons in the strong solar emission line at Lyman α at a wavelength of 121.7 nm. (The Lyman series is a related sequence of wavelengths that describe electromagnetic energy given off by energized atoms in the ultraviolet region.) Lyman α emissions are weakly absorbed by the major components of the atmosphere—O, O2, and N2—but they are absorbed readily by NO and have sufficient energy to ionize this relatively unstable compound. Despite the low abundance of NO, the high flux of solar radiation at Lyman α is able to provide a significant source of ionization for the D region near 90 km (55 miles).
(ionosphere and magnetosphere. (2011). Encyclopædia Britannica. Encyclopædia Britannica Ultimate Reference Suite. Chicago: Encyclopædia Britannica.)
Possible model

Conflicting views:
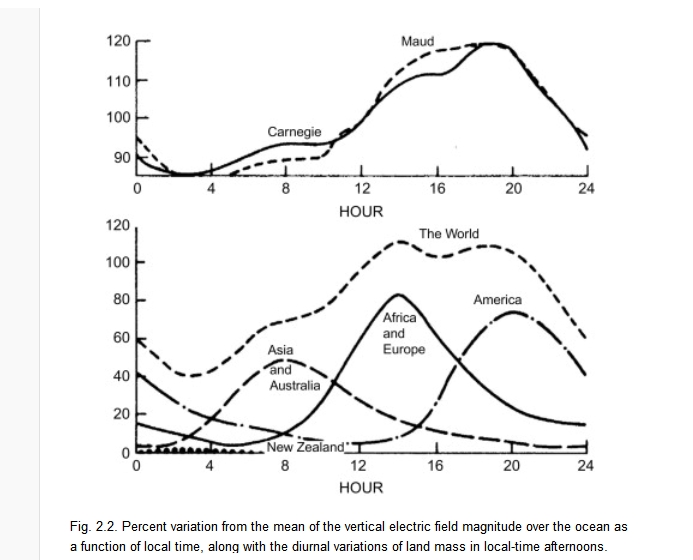
Each piece of information we can get should give a clue or, at least, tell you something about it. Here is an interesting phenomenon: If we measure the current (which is more stable than the potential gradient) over the sea, for instance, or in careful conditions, and average very carefully so that we get rid of the irregularities, we discover that there is still a daily variation. The average of many measurements over the oceans has a variation with time roughly as shown in Fig. 9–5. The current varies by about ±15 percent, and it is largest at 7:00 p.m. in London. The strange part of the thing is that no matter where you measure the current—in the Atlantic Ocean, the Pacific Ocean, or the Arctic Ocean—it is at its peak value when the clocks in London say 7:00 p.m.! All over the world the current is at its maximum at 7:00 p.m. London time and it is at a minimum at 4:00 a.m. London time. In other words, it depends upon the absolute time on the earth, not upon the local time at the place of observation. In one respect this is not mysterious; it checks with our idea that there is a very high conductivity laterally at the top, because that makes it impossible for the voltage difference from the ground to the top to vary locally. Any potential variations should be worldwide, as indeed they are. What we now know, therefore, is that the voltage at the “top” surface is dropping and rising by 15 percent with the absolute time on the earth.
People have made estimates of how much lightning is striking world-wide at any time, and perhaps needless to say, their estimates more or less agree with the voltage difference measurements: the total amount of thunderstorm activity is highest on the whole earth at about 7:00 p.m. in London. However, the thunderstorm estimates are very difficult to make and were made only after it was known that the variation should have occurred.
Fig. 9–5

The Feynman Lectures on Physics Vol. II Ch. 9_ Electricity in the Atmosphere.html
…………………………………………………………….
Data from Earth-orbiting satellites show that, on average, about 80 percent of lightning flashes occur over land and 20 percent over the oceans. The frequency of lightning over land tends to peak in the mid-afternoon between 3:00 and 6:00 PM local time”
“thunderstorm.” Encyclopædia Britannica. Encyclopædia Britannica Ultimate Reference Suite.
Chicago: Encyclopædia Britannica, 2011.
global-lightning-crop-b-en-t.
sciencedirect.com atmospheric-electricity
THE GEOMAGNETIC OFFSET:
The geomagnetic and geographic poles are not coincident – there is a substantial offset. At this time (2020) the geomagnetic North Pole lies some 1000km south of the geographic pole on Longitude 72.7º W. (wdc.kugi.kyoto-u.ac.jp)
This discrepancy should show up in the data. Readings taken at this longitude should show a larger amplitude against those at other longitudes. If this is the case it could explain the 7:00 PM anomaly.
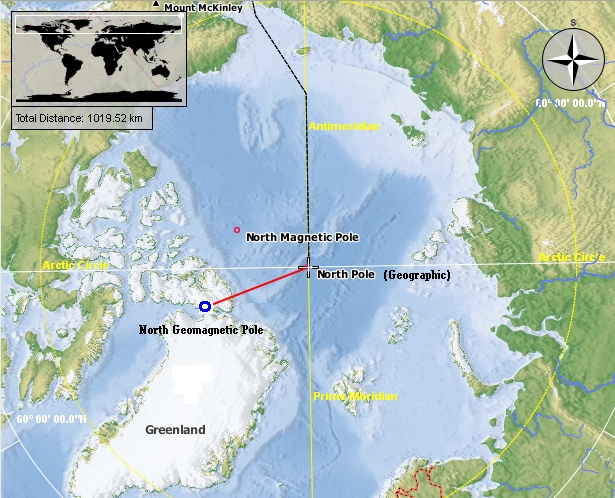
From ‘Marble’ software.
INTERFERENCE:
Pulse interference caused by an extractor fan being switched off.
ANTENNA: NEW CONFIGURATION
MAIN UNIT V1b
DC GAIN ~ 25
AC GAIN ~ 100

This is a negative inductive transient pulse heavily damped by the low-pass filters.
Pulse interference caused by a colour TV being turned on.
20” Colour TV: Estimated EHT Potential +20KV
Distance to antenna 130cm
ANTENNA: NEW CONFIGURATION
MAIN UNIT V1b
DC GAIN ~ 25
AC GAIN ~ 100

This is a positive capacitative transient pulse heavily damped by the low-pass filters.
Pulse interference caused by a colour TV being turned off:
20” Colour TV: Estimated EHT Potential +20KV
Distance to antenna 130cm
ANTENNA: NEW CONFIGURATION
MAIN UNIT V1b
DC GAIN ~ 25
AC GAIN ~ 100
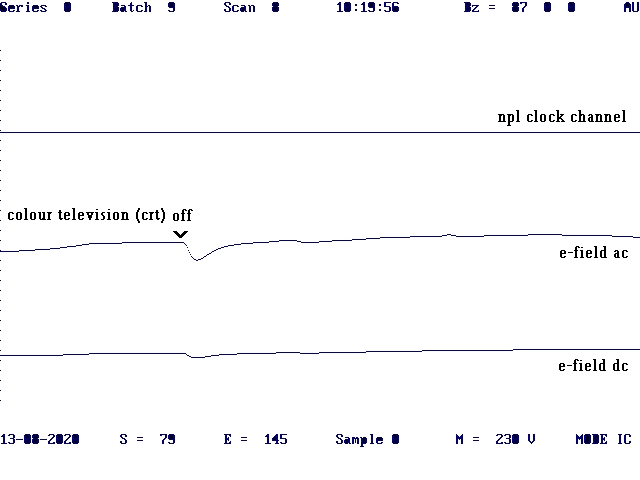
This is a negative capacitative transient pulse heavily damped by the low-pass filters.
DC interference caused by an electric heater switching on/off:
ANTENNA: ORIGINAL CONFIGURATION
MAIN UNIT V0
DC GAIN ~ 1
AC GAIN ~ 100
This was an electric convector heater with no blower. It had two heater settings 750Watts and 1250Watts. Both settings gave a similar downward trend of the DC field in the room where it was situated with the higher setting more pronounced. The heater automatically switched on and off under the control of a thermostat. The effect on the antenna down-lead, which wasn’t screened at the time, was attributed to ionised air shunting part of the tropospheric current to earth.

Close proximity of a human:
ANTENNA: ORIGINAL CONFIGURATION
MAIN UNIT: HYBRID CIRCUIT (V0 with input on jfet and C10-10uf not fitted)
DC GAIN ~ 23
AC GAIN ~ 100


This response is probably due to reduced air resistance between body and antenna.

All three waveforms are transient responses but have different rise and fall times. As the hardware characteristics were constant this must be the result of different electrical characteristics between source and antenna. The resistance is most likely responsible for the discrepancies and would cause the lightning strike response to be the most sluggish.
FURTHER OBSERVATIONS:
Response coincident with rain:
Sudden heavy rain shower on the 19th of December 2020 that lasted a few minutes.
ANTENNA: NEW CONFIGURATION
MAIN UNIT V1b
DC GAIN ~ 25
AC GAIN ~ 100

Possible mechanisms:
a) Transport of charge from the regions of higher potential.
b) Increase in the effective surface area of the antenna due to the wet roof.
c) Decreased resistance of the air column.
d) Charged cloud.
Prolonged light rainfall on the 26th of December 2020 that lasted forty minutes.
ANTENNA: NEW CONFIGURATION
MAIN UNIT V1b
DC GAIN ~ 25
AC GAIN ~ 100

This event produced a longer and larger response. The increase in the effective surface area of the antenna due to the wet roof was considered the most likely mechanism as the D.C. field remained enhanced after the rain stopped.
Researcher and author P.F. Bithell Copyright © 2020 – 2021
IF A SCIENTIFIC STUDY OR DISCOVERY HAS NOT BEEN INDEPENDENTLY CORROBORATED THEN TREAT IT WITH CAUTION
Tags: atmospheric electricity, science

Leave a comment